
ATE · Live backtest data
ATE Backtest Report
10 instruments × 5 timeframes = 50 cells. Methodology transparent. Drawdowns shown openly. Non-result cells reported, not hidden.
Cells tested
50
Longest history
155 years
Silver, daily
Highest return
+259%
UKOIL, daily
Methodology
What the simulator models
- →15% risk per trade. Fixed risk-percent of equity, compounded with the equity curve.
- →Gap-realistic SL fills. If a bar opens past the stop, the fill is at open price (worse), not the SL level.
- →Sample-size gates. Configurations with fewer than 20 trades are excluded from optimizer selection. Keeps cells like Nifty 4h (3 trades) from gaming the smart-score.
- →No leverage. Returns compound on equity; no margin amplification.
What it does NOT model
Headline P&L is gross of execution costs. The simulator does not deduct brokerage or per-tick slippage. Use the drag estimator below to convert to a realistic net expectation for your broker.
- →Brokerage / commission per trade
- →Slippage beyond the gap-realistic SL fill
- →STT, GST, capital-gains tax — vary by jurisdiction
- →Market impact at size
- →Variance in live execution (the simulator assumes the closing price of every signal bar)
Live drag estimator
Approximate execution-cost drag on flagship 1D cells. Subtract from gross P&L for a realistic net expectation.
| Instrument | Trades | Lifetime drag (est.) | Gross P&L | Net (est.) |
|---|---|---|---|---|
| UKOIL 1D | 130 over 94y | ~1.5–3% | +259.3% | ~+255–258% |
| DJI 1D | 617 over 130y | ~3–5% | +176.7% | ~+171–174% |
| SPX 1D | 577 over 149y | ~3–5% | +170.9% | ~+165–168% |
| Silver 1D | 335 over 155y | ~3–5% | +135.1% | ~+130–132% |
| Nifty 1D | 161 over 36y | ~1.5–3% | +109.6% | ~+106–108% |
| Gold 1D | 276 over 123y | ~2–4% | +107.0% | ~+103–105% |
| BTCUSD 1D | 27 over 11y | ~0.5–1% | +104.4% | ~+103–104% |
| BankNifty 1D | 137 over 26y | ~1.5–3% | +77.9% | ~+75–76% |
| NDX 1D | 177 over 41y | ~1–2% | +61.5% | ~+59–61% |
| USDINR 1D | 185 over 53y | ~2–4% | +18.2% | ~+15–16% |
Intraday cells (5m, 15m) have proportionally much larger drag because trade counts are higher relative to data span. BankNifty 5m’s 168 trades in just over a year are likely close to breakeven once realistic costs are deducted, even though the gross is +2.0%.
The full 50-cell matrix
Gross P&L for every cell. Cells with dashes had no qualifying trades on TradingView’s data feed — reported in full for transparency.
| Instrument | 5m | 15m | 1h | 4h | 1D |
|---|---|---|---|---|---|
| Nifty | +1.1% | +1.9% | +3.0% | +0.4% | +109.6% |
| BankNifty | +2.0% | +3.2% | +1.9% | +3.9% | +77.9% |
| Gold (XAUUSD) | +1.6% | +6.6% | +8.3% | +9.4% | +107.0% |
| Silver (XAGUSD) | +3.9% | +13.5% | +17.1% | +12.5% | +135.1% |
| SPX | +1.8% | +0.9% | +10.0% | +4.7% | +170.9% |
| NDX | +3.2% | +2.7% | +6.0% | +8.9% | +61.5% |
| DJI | — | — | — | — | +176.7% |
| BTCUSD | +1.4% | +4.0% | +8.3% | +160.1% | +104.4% |
| UKOIL (Brent) | +3.2% | +3.6% | +7.0% | +13.5% | +259.3% |
| USDINR | +0.5% | +0.8% | +0.8% | +3.5% | +18.2% |
Per-instrument deep dives
Each instrument’s daily-chart screenshot shows ATE running live with the Backtest Performance table visible.
Nifty
| TF | P&L | DD | W/T | PF | RF | Data |
|---|---|---|---|---|---|---|
| 5m | +1.1% | 0.2% | 29/71 | 1.9 | 7.0 | 1.1y |
| 15m | +1.9% | 0.3% | 34/90 | 2.1 | 7.1 | 3.3y |
| 1h | +3.0% | 0.6% | 18/36 | 2.8 | 5.3 | 12.3y |
| 4h | +0.4% | 0.0% | 3/3 | 99.0 | 999 | 17.2y |
| 1D | +109.6% | 3.3% | 85/161 | 2.9 | 33.1 | 35.6y |
⚠ 4h: Non-result (3 trades)
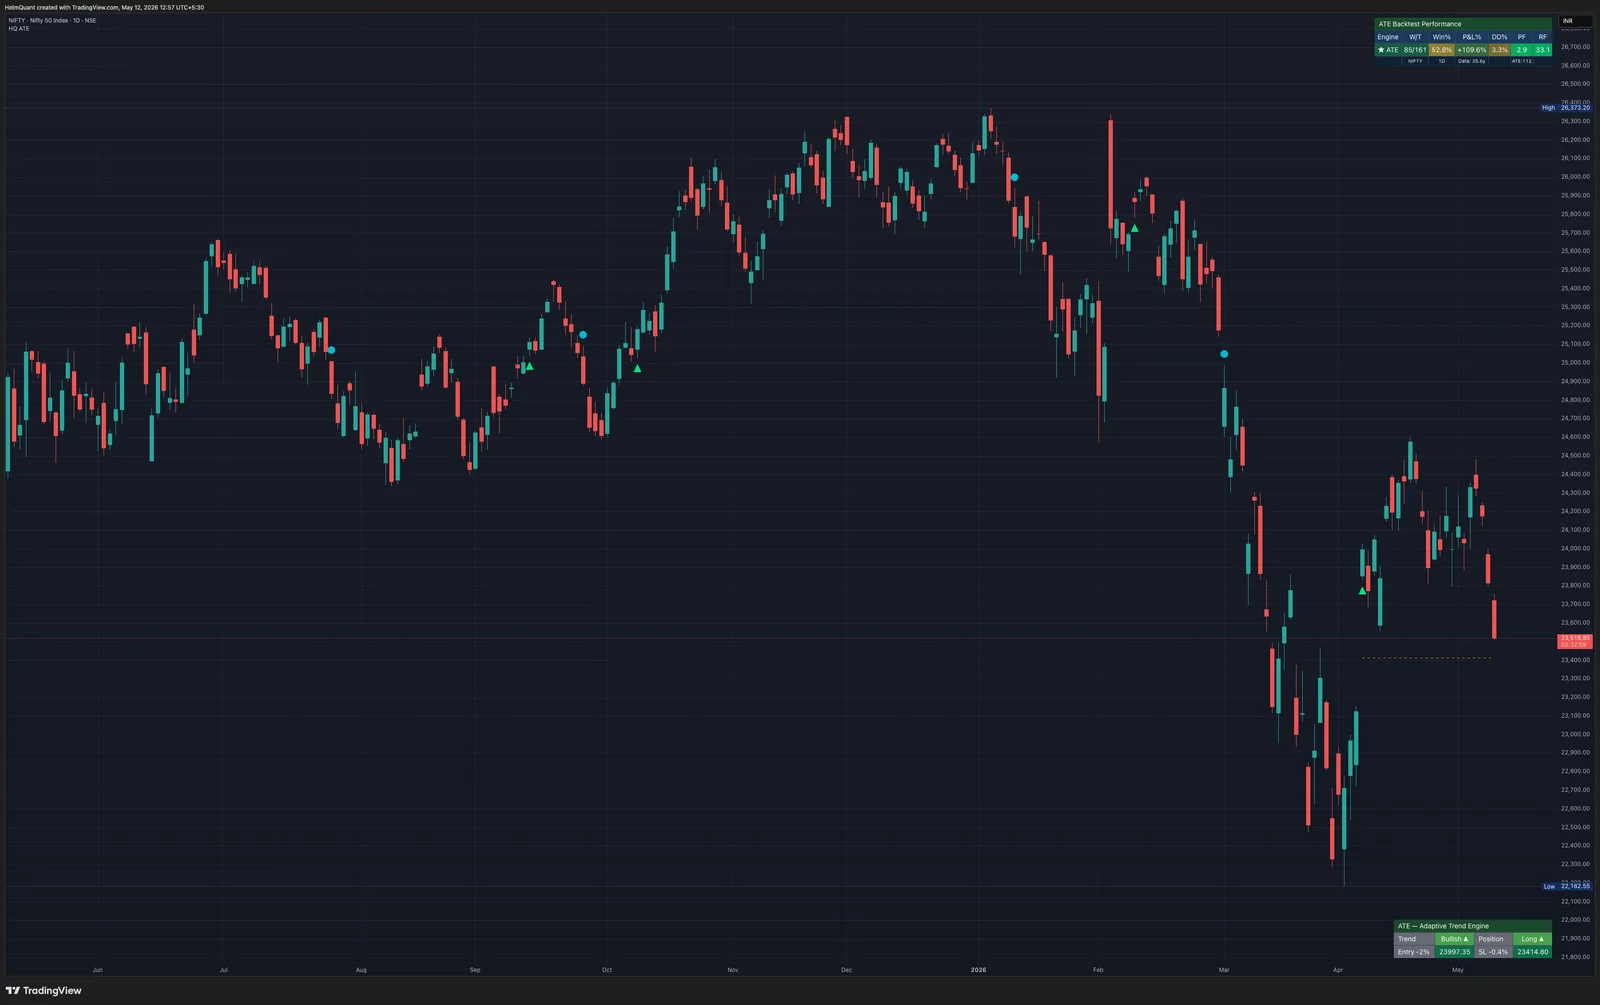
Nifty 1D — click to open at full resolution
BankNifty
| TF | P&L | DD | W/T | PF | RF | Data |
|---|---|---|---|---|---|---|
| 5m | +2.0% | 0.4% | 43/168 | 1.7 | 4.7 | 1.1y |
| 15m | +3.2% | 0.3% | 25/59 | 2.4 | 9.4 | 3.3y |
| 1h | +1.9% | 0.5% | 18/34 | 2.0 | 4.3 | 12.3y |
| 4h | +3.9% | 1.3% | 14/29 | 2.0 | 3.0 | 17.2y |
| 1D | +77.9% | 3.4% | 49/137 | 3.0 | 23.0 | 26.2y |
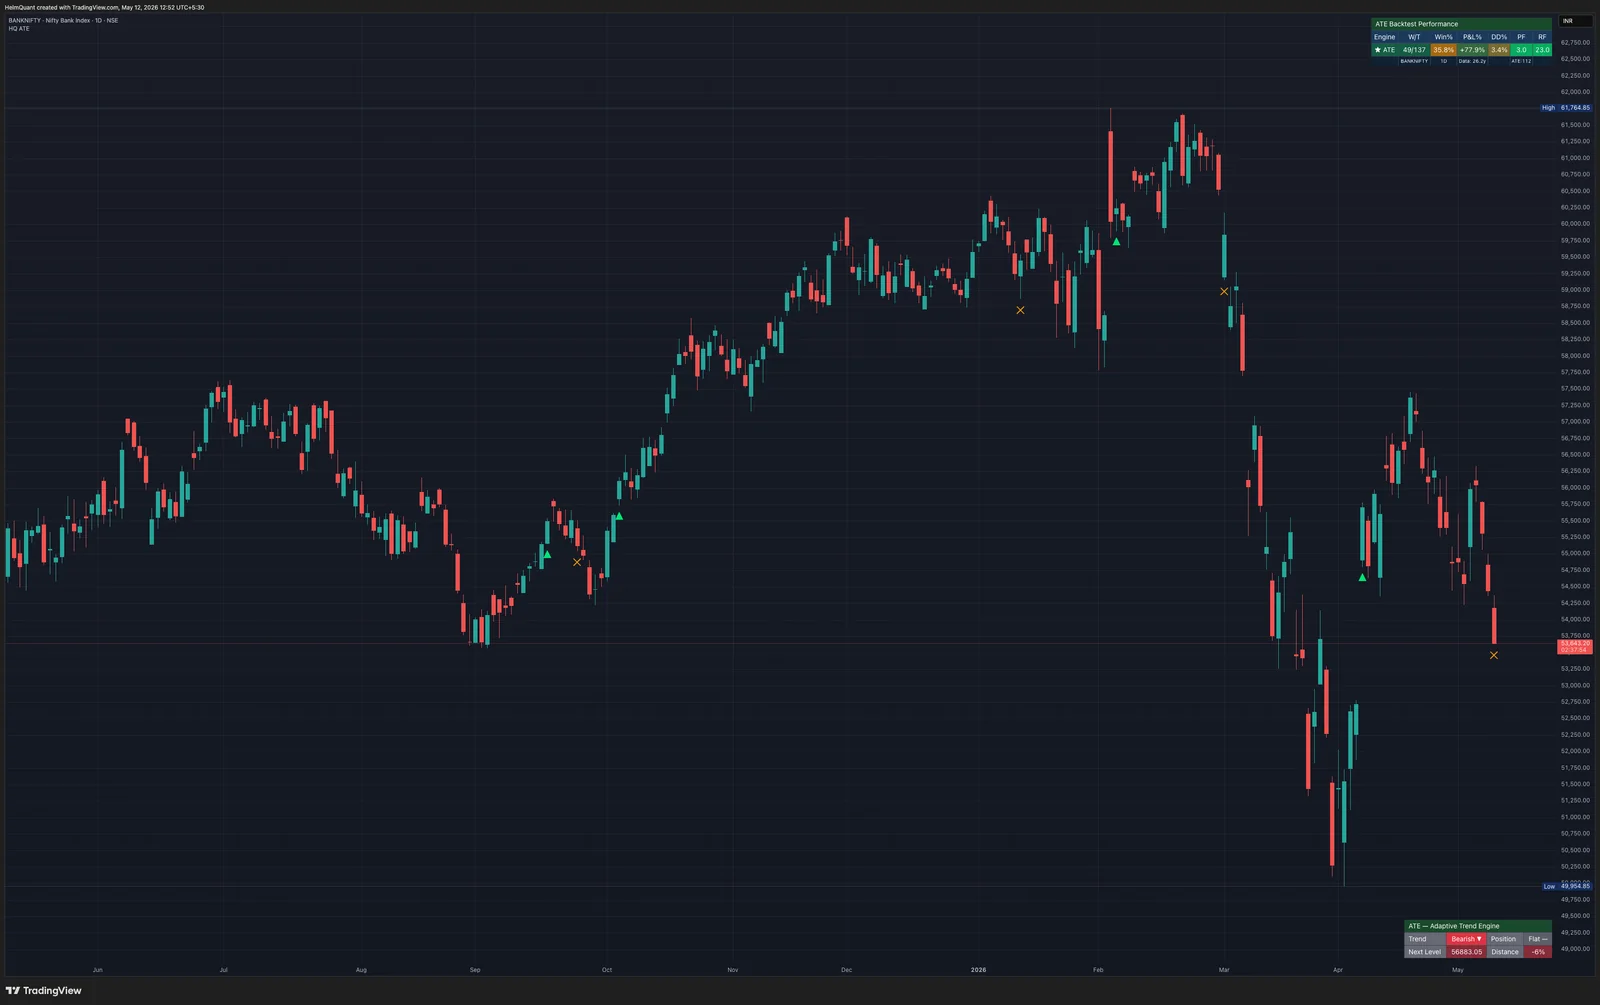
BankNifty 1D — click to open at full resolution
Gold (XAUUSD)
| TF | P&L | DD | W/T | PF | RF | Data |
|---|---|---|---|---|---|---|
| 5m | +1.6% | 0.3% | 15/34 | 2.7 | 6.2 | 0.3y |
| 15m | +6.6% | 0.6% | 46/122 | 2.5 | 10.9 | 0.9y |
| 1h | +8.3% | 1.1% | 49/91 | 2.5 | 7.6 | 4.3y |
| 4h | +9.4% | 0.6% | 24/51 | 3.9 | 14.6 | 13.3y |
| 1D | +107.0% | 4.8% | 122/276 | 2.3 | 22.2 | 123.3y |
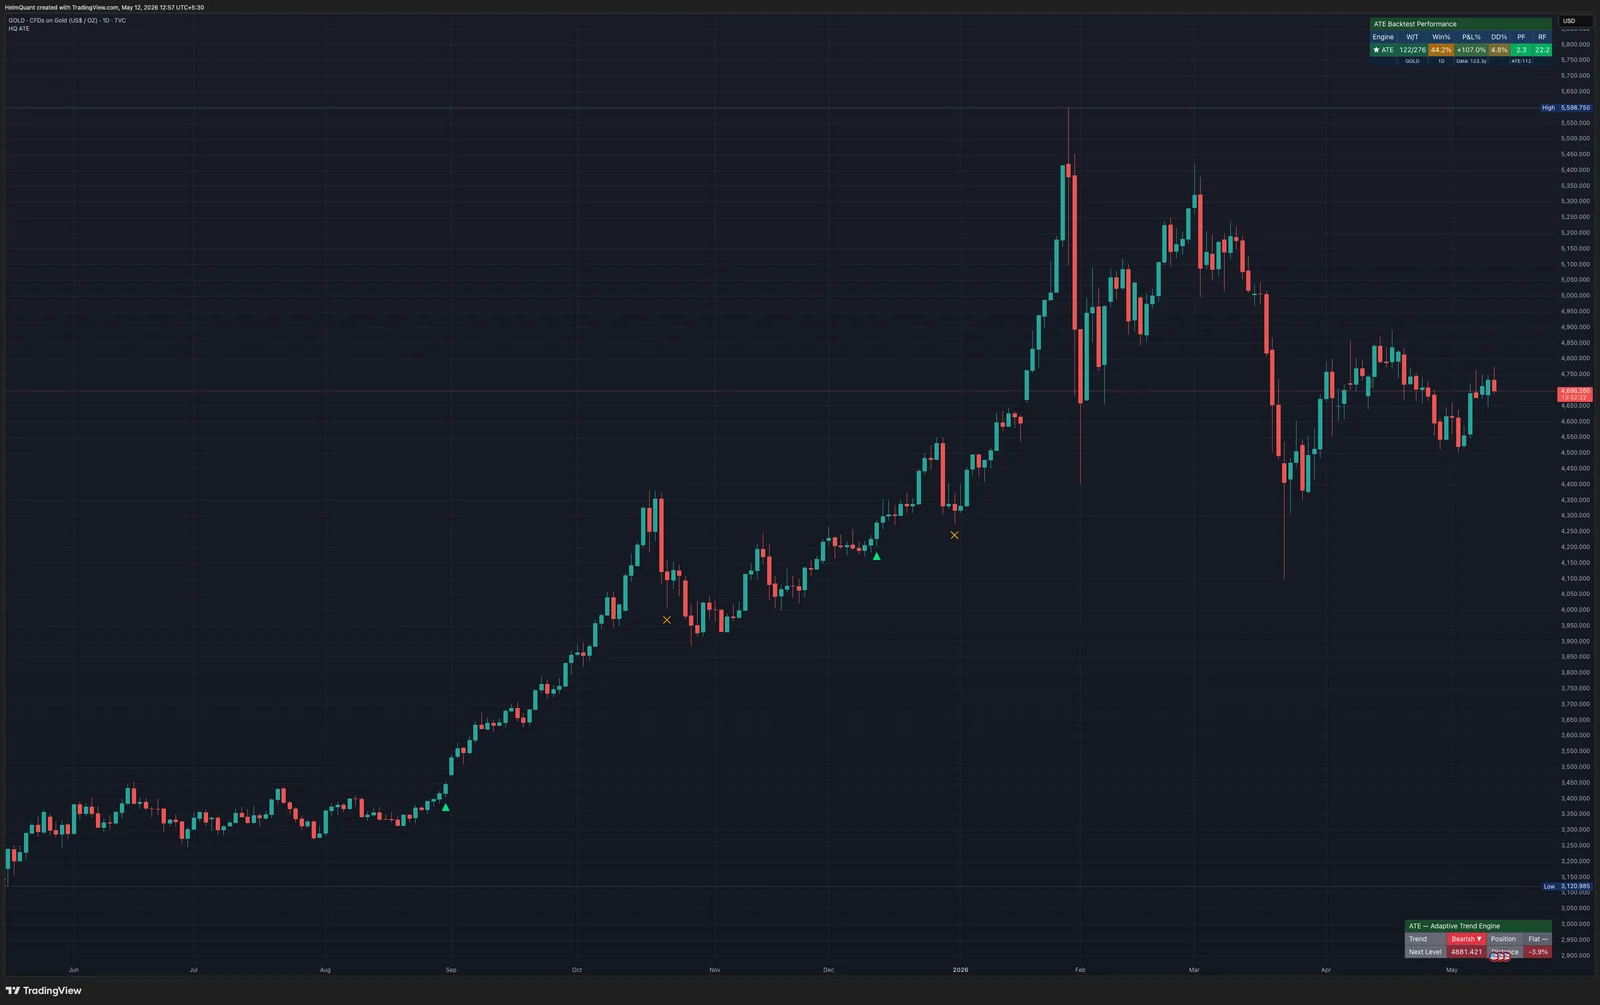
Gold (XAUUSD) 1D — click to open at full resolution
Silver (XAGUSD)
| TF | P&L | DD | W/T | PF | RF | Data |
|---|---|---|---|---|---|---|
| 5m | +3.9% | 0.6% | 31/91 | 2.0 | 6.0 | 0.3y |
| 15m | +13.5% | 1.3% | 66/147 | 2.0 | 10.2 | 0.9y |
| 1h | +17.1% | 1.5% | 62/138 | 2.0 | 11.2 | 4.3y |
| 4h | +12.5% | 3.6% | 24/58 | 1.8 | 3.5 | 13.3y |
| 1D | +135.1% | 11.2% | 134/335 | 1.6 | 12.1 | 155.3y |
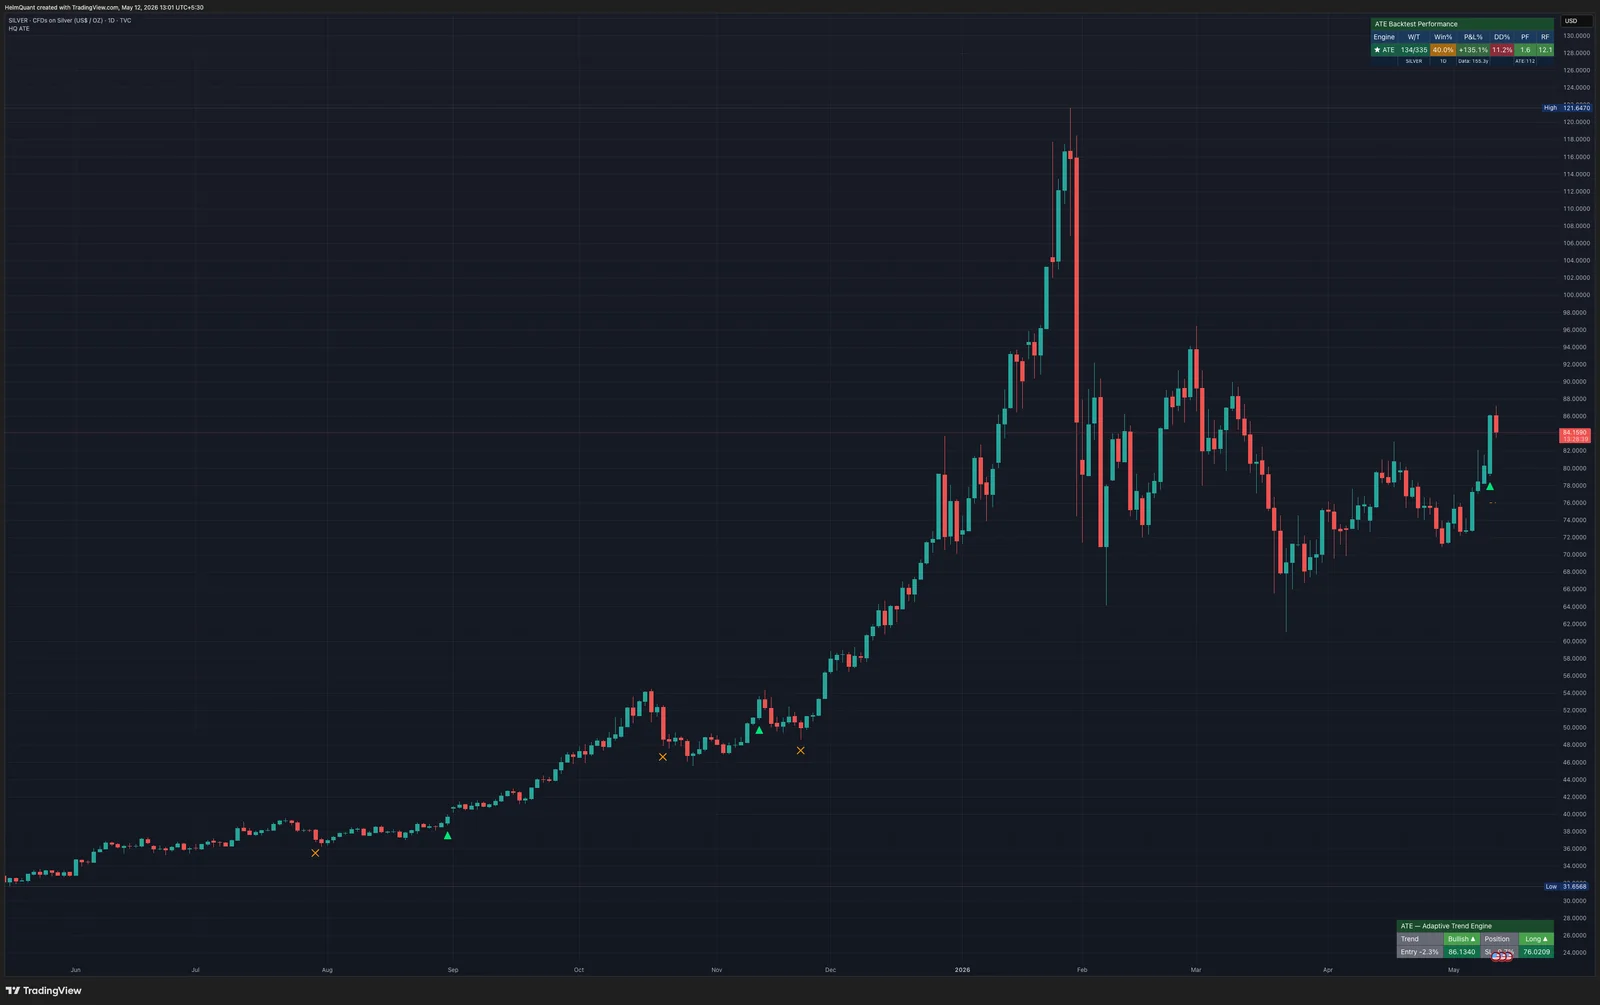
Silver (XAGUSD) 1D — click to open at full resolution
SPX
| TF | P&L | DD | W/T | PF | RF | Data |
|---|---|---|---|---|---|---|
| 5m | +1.8% | 0.3% | 49/107 | 2.2 | 7.1 | 1y |
| 15m | +0.9% | 0.2% | 18/44 | 2.1 | 4.5 | 3y |
| 1h | +10.0% | 1.3% | 132/298 | 1.5 | 7.8 | 12.3y |
| 4h | +4.7% | 0.6% | 15/23 | 4.2 | 8.4 | 26.3y |
| 1D | +170.9% | 7.2% | 257/577 | 1.9 | 23.7 | 149.5y |
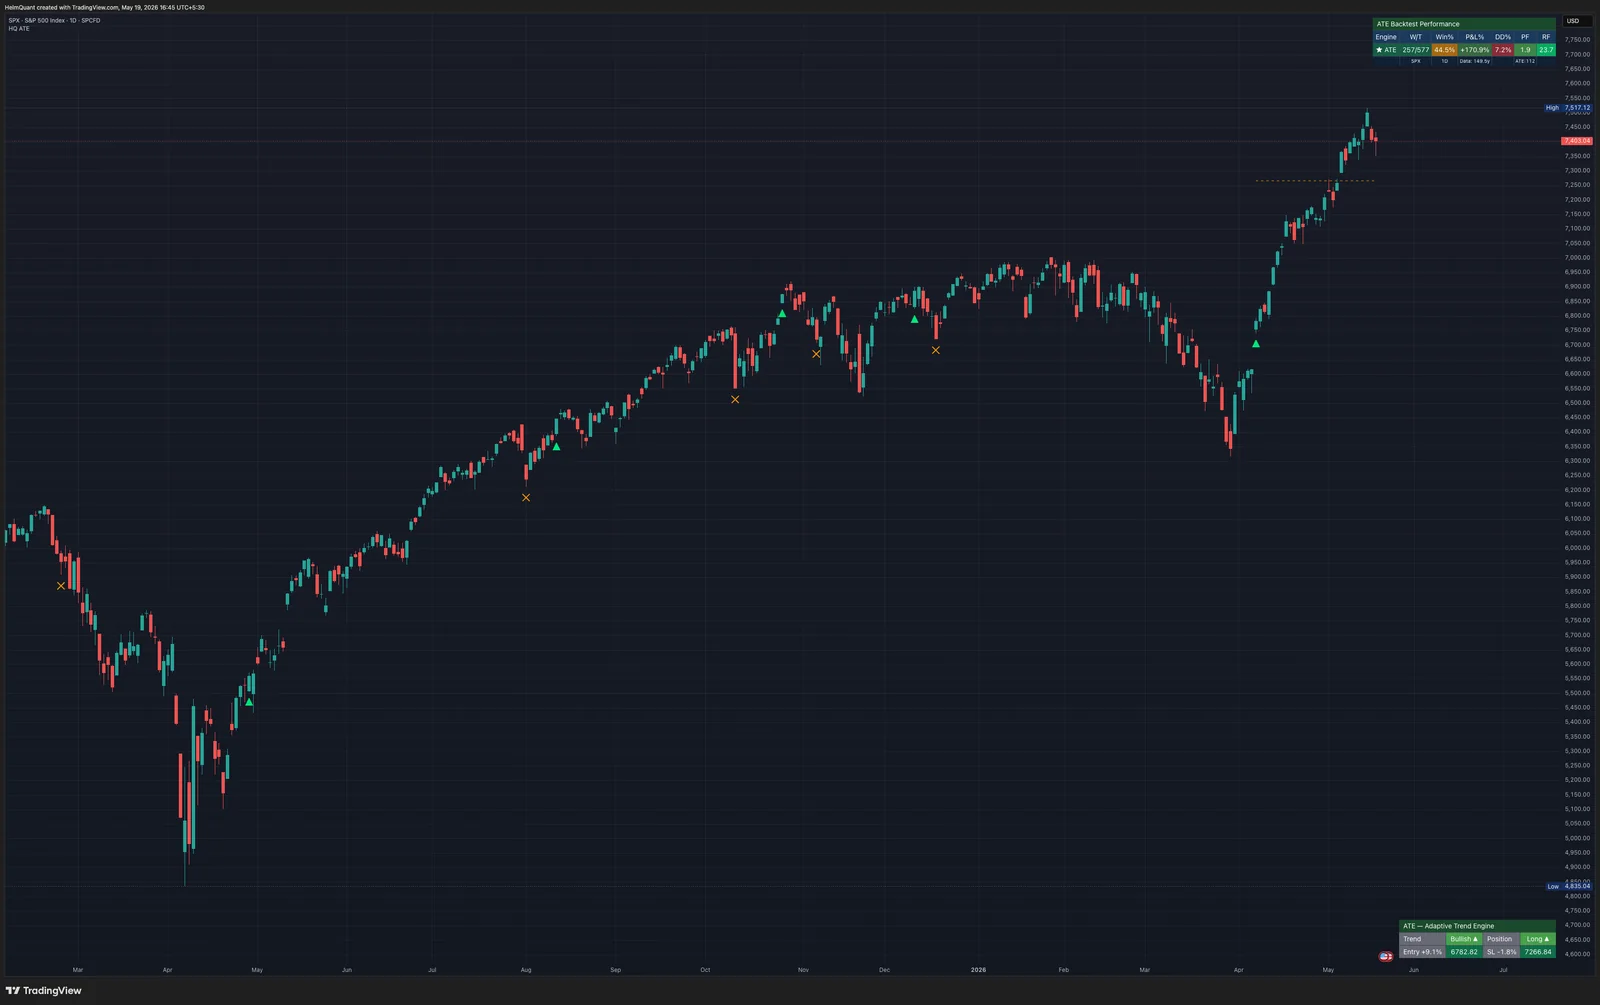
SPX 1D — click to open at full resolution
NDX
| TF | P&L | DD | W/T | PF | RF | Data |
|---|---|---|---|---|---|---|
| 5m | +3.2% | 0.2% | 33/58 | 4.7 | 14.5 | 1y |
| 15m | +2.7% | 0.4% | 27/53 | 2.8 | 7.4 | 3y |
| 1h | +6.0% | 0.4% | 19/33 | 4.5 | 16.4 | 12.3y |
| 4h | +8.9% | 0.0% | 7/7 | 99.0 | 999 | 26.3y |
| 1D | +61.5% | 3.4% | 72/177 | 2.2 | 17.8 | 41.1y |
⚠ 4h: Non-result (7 trades)
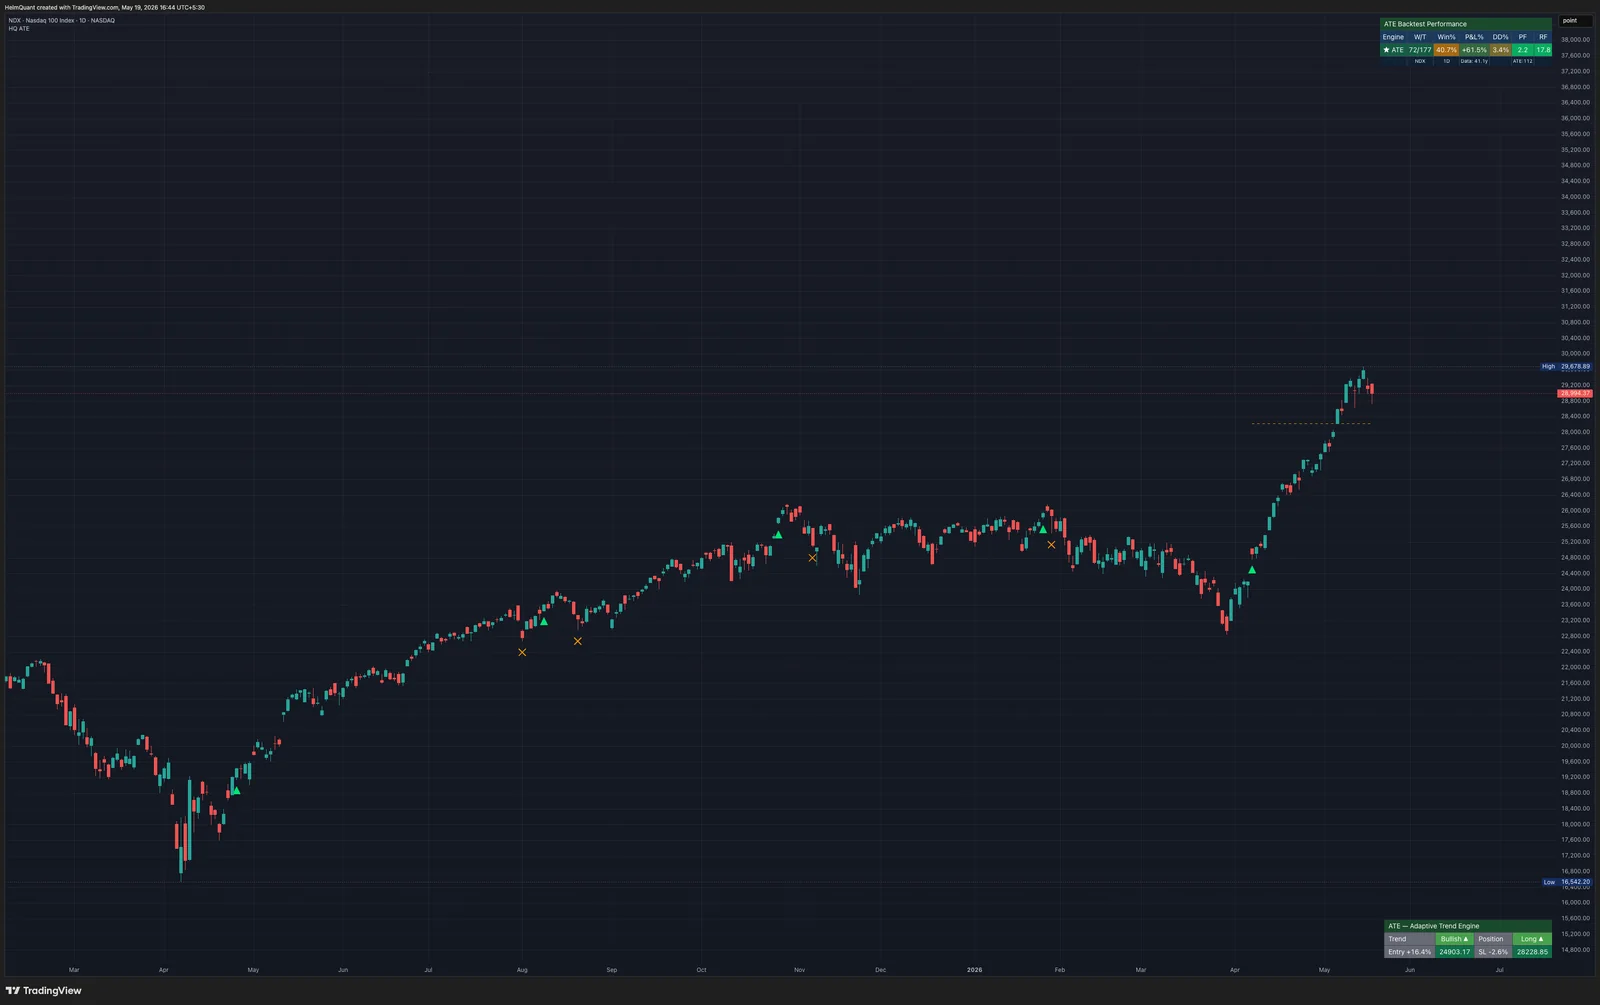
NDX 1D — click to open at full resolution
DJI
| TF | P&L | DD | W/T | PF | RF | Data |
|---|---|---|---|---|---|---|
| 5m | no qualifying trades | |||||
| 15m | no qualifying trades | |||||
| 1h | no qualifying trades | |||||
| 4h | no qualifying trades | |||||
| 1D | +176.7% | 7.2% | 278/617 | 1.7 | 24.7 | 129.8y |
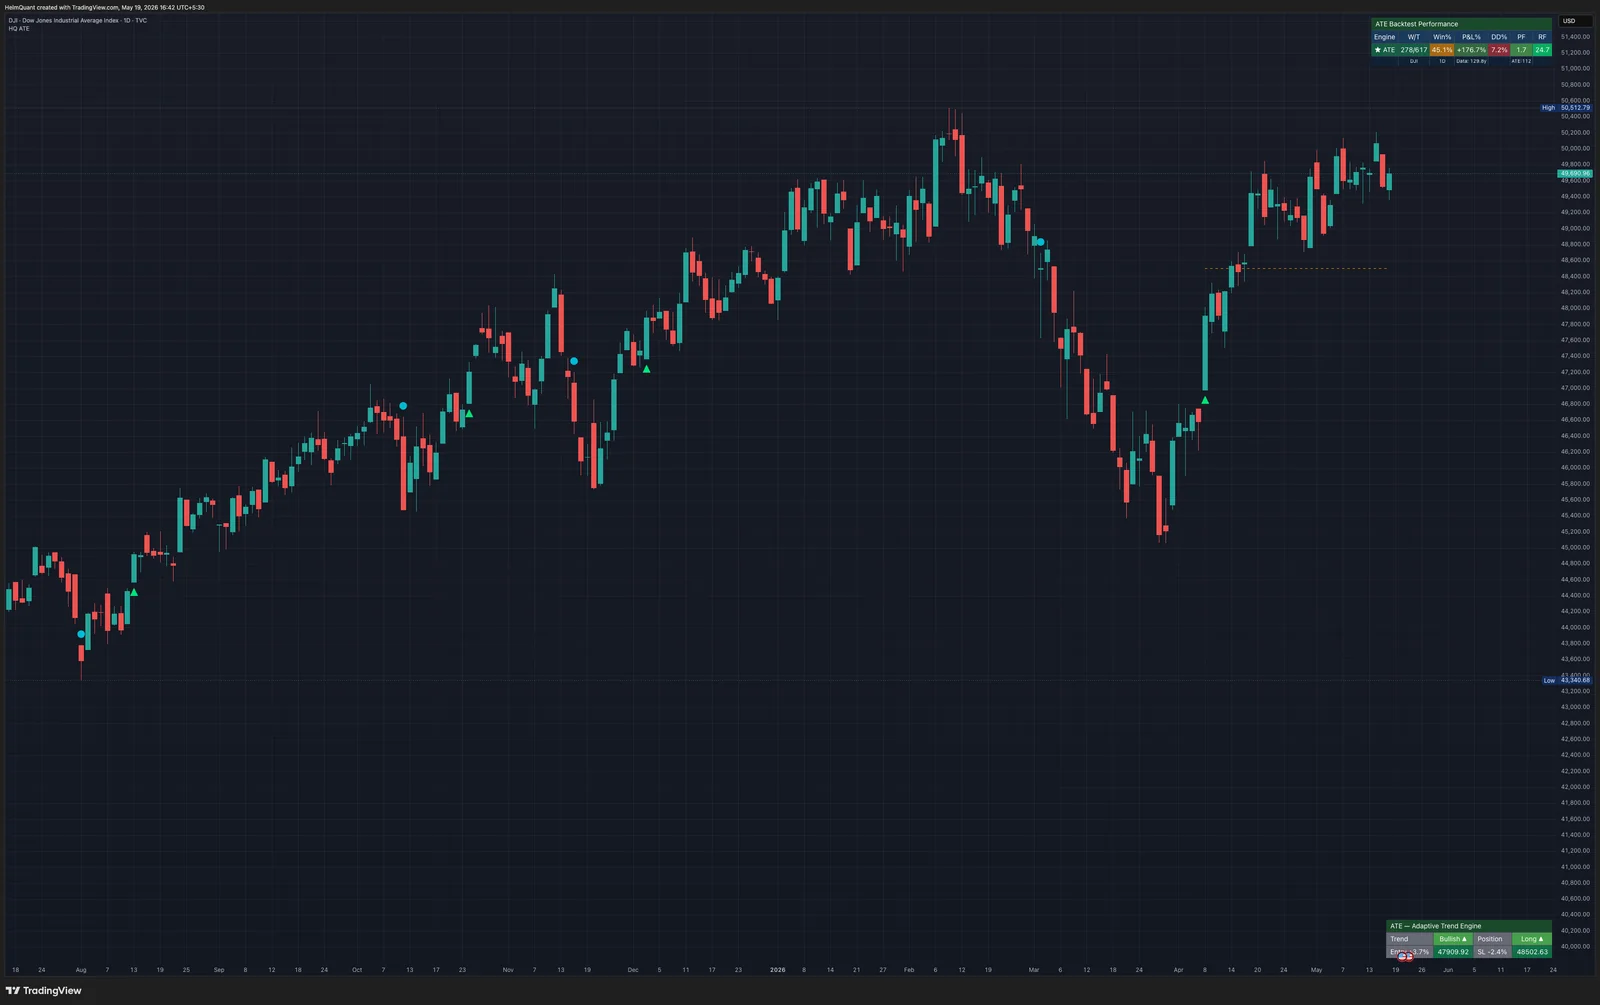
DJI 1D — click to open at full resolution
BTCUSD
| TF | P&L | DD | W/T | PF | RF | Data |
|---|---|---|---|---|---|---|
| 5m | +1.4% | 0.6% | 36/107 | 1.5 | 2.2 | 0.2y |
| 15m | +4.0% | 1.6% | 103/282 | 1.2 | 2.5 | 0.6y |
| 1h | +8.3% | 1.7% | 37/86 | 1.8 | 5.0 | 2.4y |
| 4h | +160.1% | 4.3% | 75/175 | 2.7 | 37.6 | 9.4y |
| 1D | +104.4% | 4.3% | 15/27 | 4.5 | 24.4 | 11.2y |
⚠ 4h: Standout cell
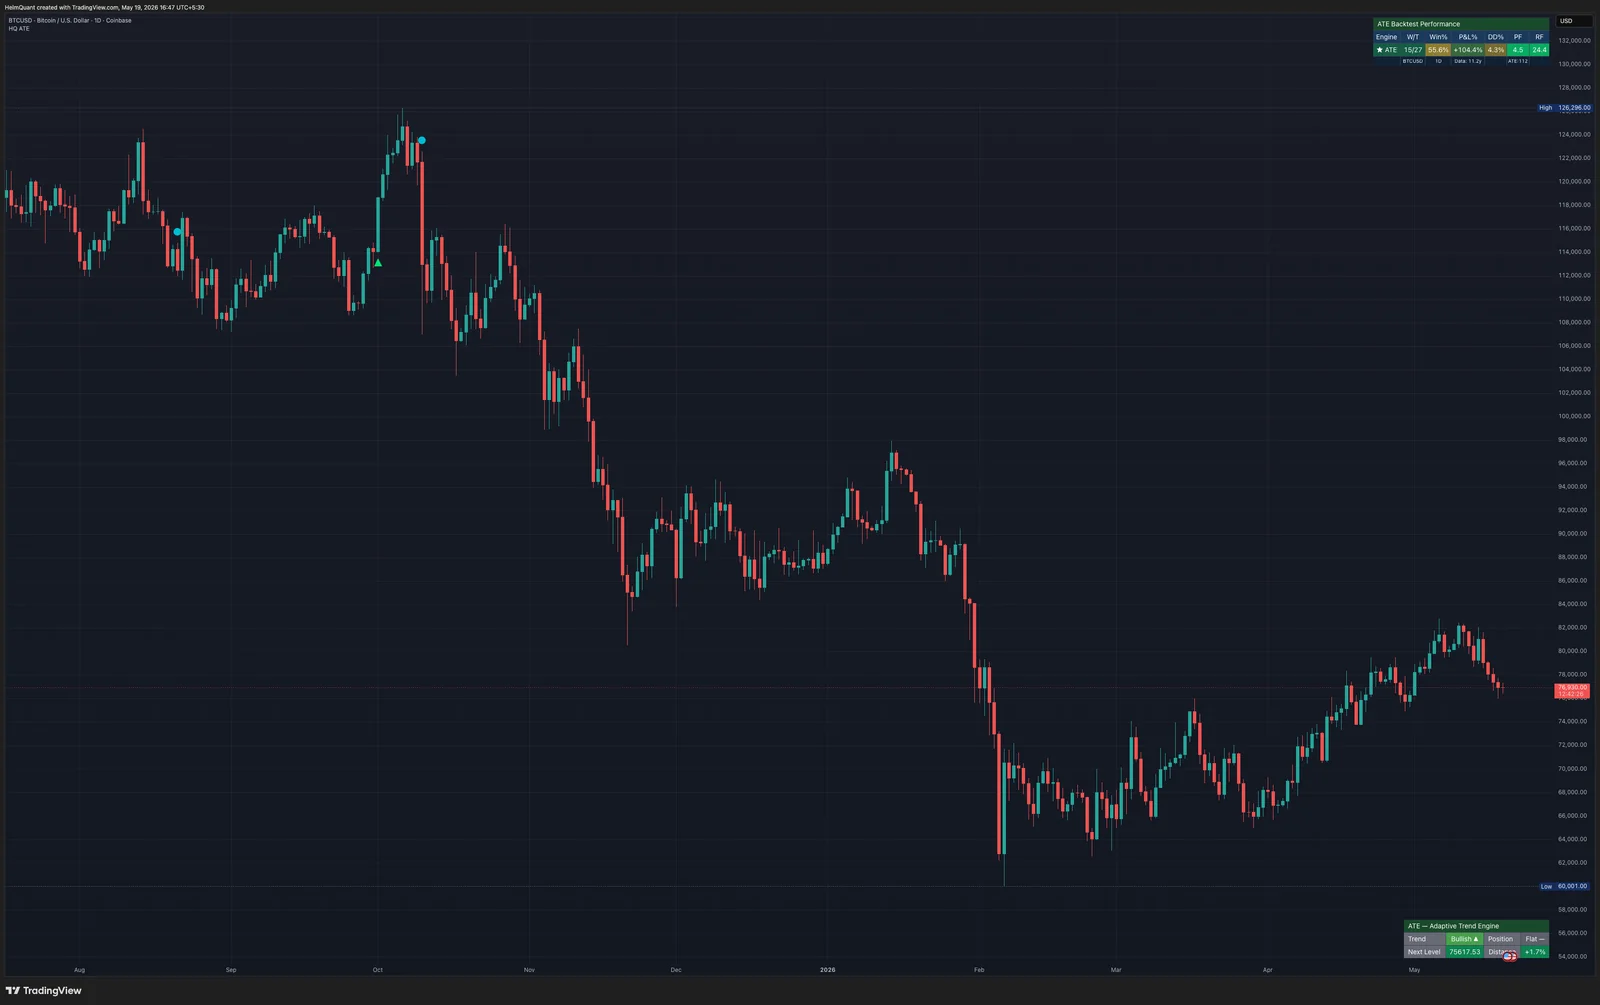
BTCUSD 1D — click to open at full resolution
UKOIL (Brent)
| TF | P&L | DD | W/T | PF | RF | Data |
|---|---|---|---|---|---|---|
| 5m | +3.2% | 0.8% | 22/61 | 2.3 | 3.8 | 0.3y |
| 15m | +3.6% | 1.6% | 31/107 | 1.5 | 2.2 | 0.9y |
| 1h | +7.0% | 1.3% | 16/40 | 2.5 | 5.3 | 4.4y |
| 4h | +13.5% | 1.6% | 52/167 | 1.7 | 8.6 | 13.3y |
| 1D | +259.3% | 11.2% | 61/130 | 2.2 | 23.2 | 94.4y |
→ Highest return
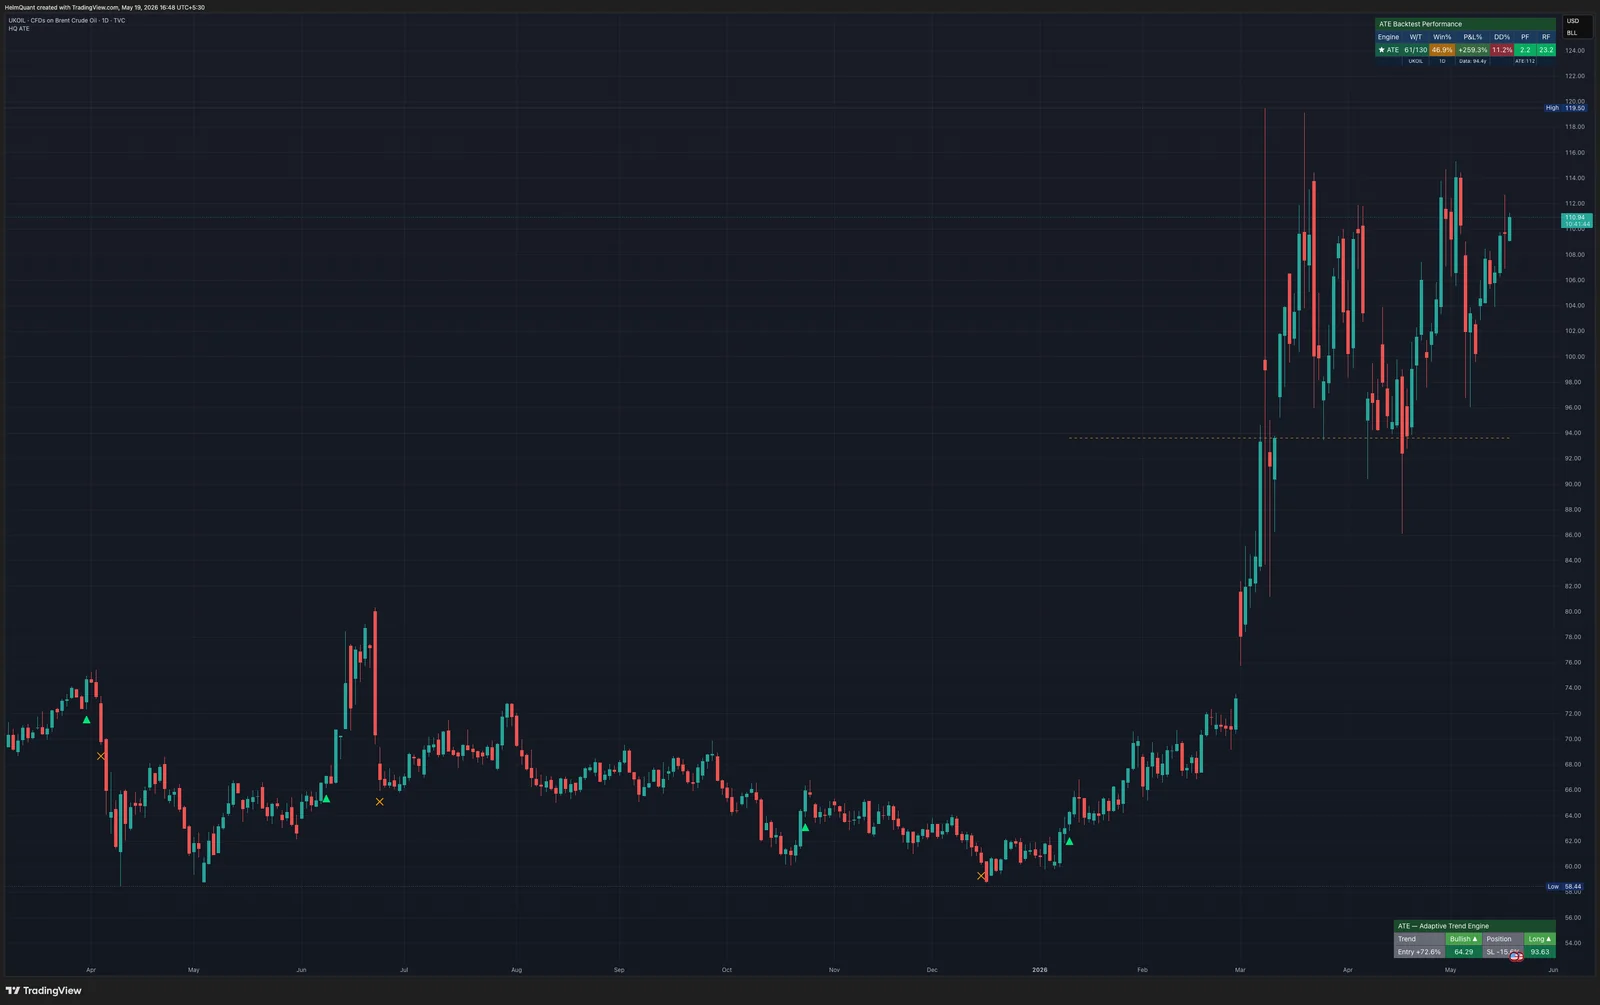
UKOIL (Brent) 1D — click to open at full resolution
USDINR
| TF | P&L | DD | W/T | PF | RF | Data |
|---|---|---|---|---|---|---|
| 5m | +0.5% | 0.1% | 41/110 | 2.1 | 9.9 | 0.4y |
| 15m | +0.8% | 0.1% | 52/122 | 2.0 | 9.7 | 1.1y |
| 1h | +0.8% | 0.2% | 27/66 | 1.7 | 4.3 | 4.4y |
| 4h | +3.5% | 1.2% | 86/199 | 1.4 | 3.1 | 14.3y |
| 1D | +18.2% | 3.9% | 74/185 | 2.3 | 4.7 | 53.2y |
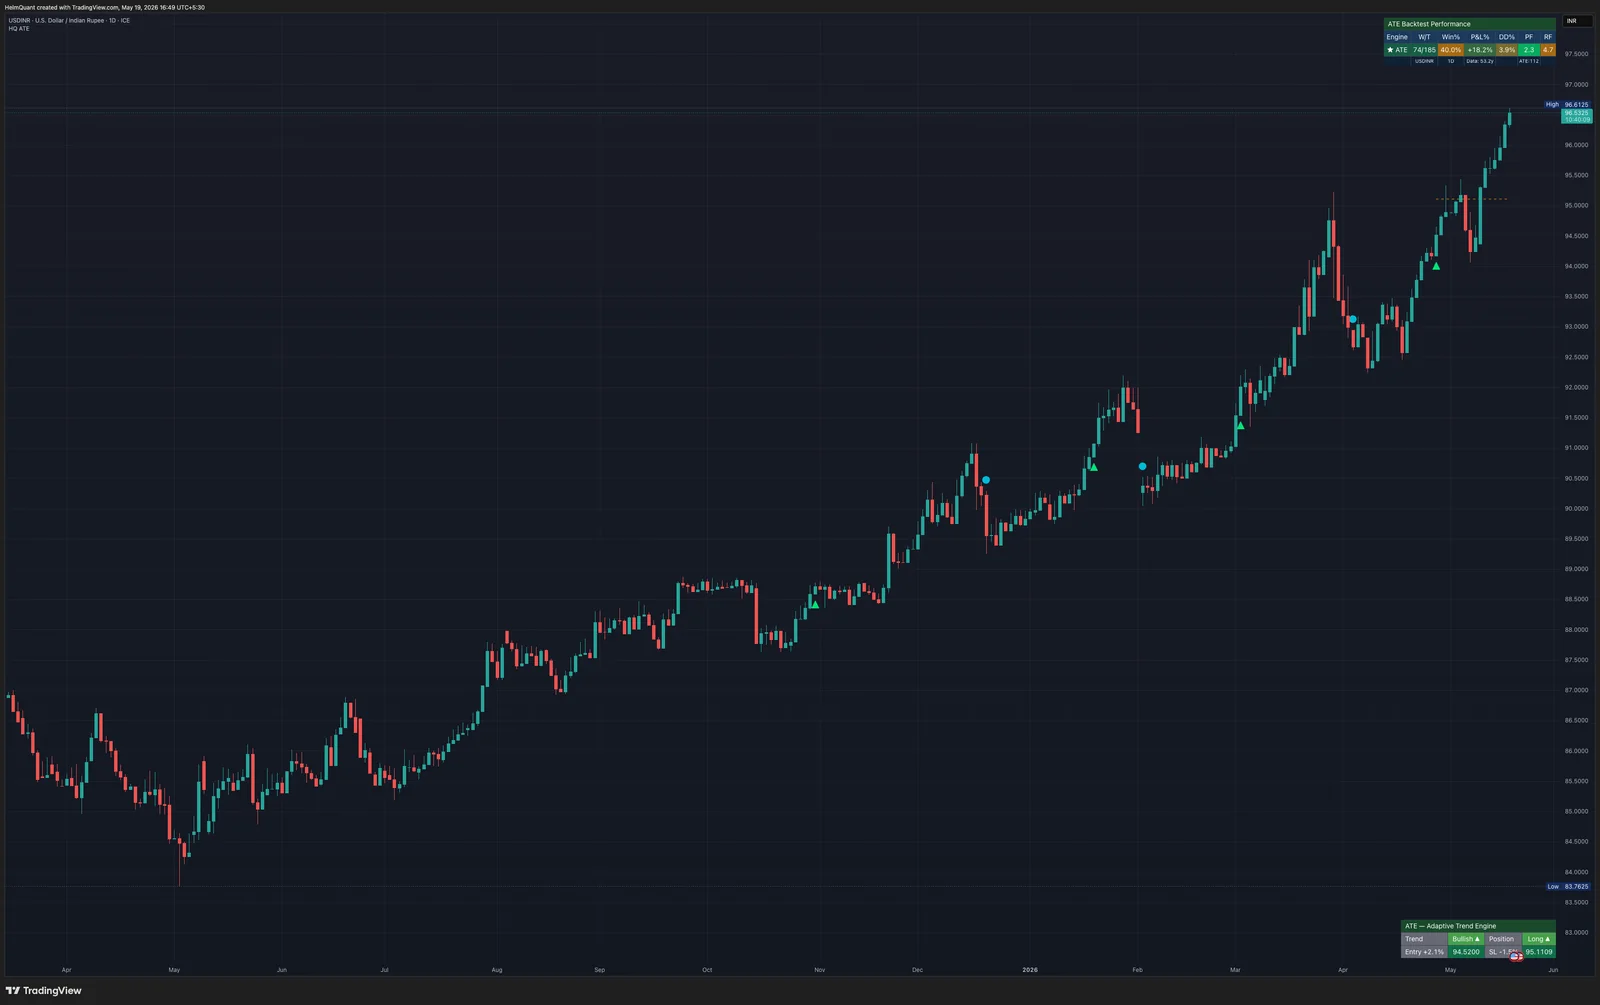
USDINR 1D — click to open at full resolution
Cross-cutting observations
1.Daily timeframe wins on 9 out of 10 instruments
The 1D cell is the highest-P&L row for every instrument except BTCUSD, where 4h edges out 1D by a hair. Trend signals are cleanest on daily bars where intraday noise washes out.
2.Win rates under 50% are the norm
8 of 10 flagship 1D cells win fewer than half their trades. The PF of 1.6–4.5 across these cells means winners are 1.6–4.5× the size of losers on average — that’s where the edge lives. If you can’t psychologically tolerate losing 55–60% of trades while still ending the year up, ATE isn’t for you.
3.Two genuine intraday exceptions
BTCUSD 4h — +160% with RF 37.6 over 9.4 years; the highest 4h Return Factor in the matrix. Crypto trends are durable enough on a 4h chart that ATE catches them cleanly. NDX 1h — PF 4.5 over 12.3 years; the cleanest 1h profit factor anywhere. Otherwise, sub-1h cells produce toy returns once execution costs are deducted.
4.Cells that should not be traded
Nifty 4h (3 trades over 17 years). NDX 4h (7 trades, 100% win-rate — curve-fit on a small sample). DJI intraday (no qualifying trades on TradingView’s feed at any sub-daily timeframe). Reported in full because hiding them would be dishonest. Don’t trade them.
5.Return scale follows volatility
The largest returns (UKOIL +259%, DJI +177%, SPX +171%, Silver +135%) come from instruments with the longest history and moderate-to-high volatility. The smallest (USDINR +18%) comes from the calmest instrument. The trend-follower’s deal stated plainly: bigger trends → bigger returns, with proportional drawdowns to match.
Recommended cell per instrument
| Instrument | Primary TF | Reasoning |
|---|---|---|
| Nifty | 1D | RF 33.1 — best risk-adjusted cell in matrix. 4h is non-result, avoid. |
| BankNifty | 1D | Mirrors Nifty pattern; 4h reasonable for lower-frequency signals. |
| Gold | 1D | Best returns + lowest DD on 1D commodities. 4h has best PF (3.9). |
| Silver | 1h or 1D | 1h for risk-adjusted (DD 1.5%); 1D for max upside but plan for 11.2% drawdown. |
| SPX | 1D | 150y of data, RF 23.7, 577 trades. Strongest single sample in matrix. |
| NDX | 1D | Cleanest US-index DD (3.4%). 1h has best PF in 1h row (4.5). |
| DJI | 1D only | Intraday is empty on TradingView's DJI feed. 1D is +176.7% over 130y. |
| BTCUSD | 4h or 1D | 4h is the standout 4h cell in matrix (+160%, RF 37.6). 1D has highest 1D PF (4.5). |
| UKOIL | 1D | Highest absolute return in matrix (+259%). Accept the 11.2% DD or skip. |
| USDINR | 1D | FX-scale returns (+18%) and FX-scale drawdowns (3.9%). Ballast or skip. |
What this report does not tell you
- Live trading variance. The simulator assumes you got the closing price of every signal bar. Real execution will differ — sometimes better with limit orders, more often slightly worse with slippage.
- Execution costs at scale. The simulator does not deduct brokerage or per-tick slippage. The drag estimator above gives you a way to subtract realistic costs yourself.
- Taxes and exchange charges. None of the local-jurisdiction taxes (STT/GST in India, 1099 reporting in the US, equivalents elsewhere) are modelled. Account for them yourself.
- Sample concentration. Some cells span regime changes — gold-standard transitions, demonetisation, COVID, central-bank intervention cycles. Past trend-following performance under those regimes is not a guarantee.
- You. The biggest variable in live trading is the trader. ATE producing +109% Nifty 1D in the simulator does not produce +109% in your account if you override signals, skip trades during drawdowns, or size emotionally.
ATE is a software tool. It does not provide investment advice. Every trading decision is yours. Backtest performance is not future performance. Past results shown here were generated by a deterministic simulator using TradingView’s historical price data — they do not represent actual trading P&L on any real account. Helm Quant is not a registered investment advisor in any jurisdiction.
Try ATE free for 7 days
Email us your TradingView username and we’ll send a 7-day invite. Run ATE on your own charts and verify these numbers yourself.
Request trial access